
The Racing Metrics - KPI Tool
Vast Amounts of data are both a curse and a blessing
In motorsport, traditional data analysis tools can quickly become overwhelming and confusing when engineers face even simple comparison questions like, “How is it compared to…?” The sheer volume and complexity of logged data—lap times, telemetry, tire performance, weather, and more makes it difficult to extract clear insights, especially when trying to compare multiple sessions, drivers, or setups.
When Data Overload Hides the Answers
Engineers and teams may struggle because these tools often require digging through countless files and reloading large datasets just to answer basic reference questions. As a result, valuable insights are often buried under layers of complexity, and the process can feel outdated and cumbersome.
Comparisons Shouldn’t Be Complicated
Even though advanced analytics can offer deep insights, the lack of user-friendly comparison features means that making sense of “how was it compared to last session, last driver, or last setup?” is far from straightforward.
Introducing Racing Metrics KPI Tools: Clarity from Complexity
The Racing Metrics KPI tool addresses this pain point by makinglarge-scale, multi-dataset comparisons simple and visual, enabling engineers to quickly answer reference questions and gain actionable insights—without the usual data overload.
Features
Core Features
Microsoft Excel™ Data Import of your Race Data
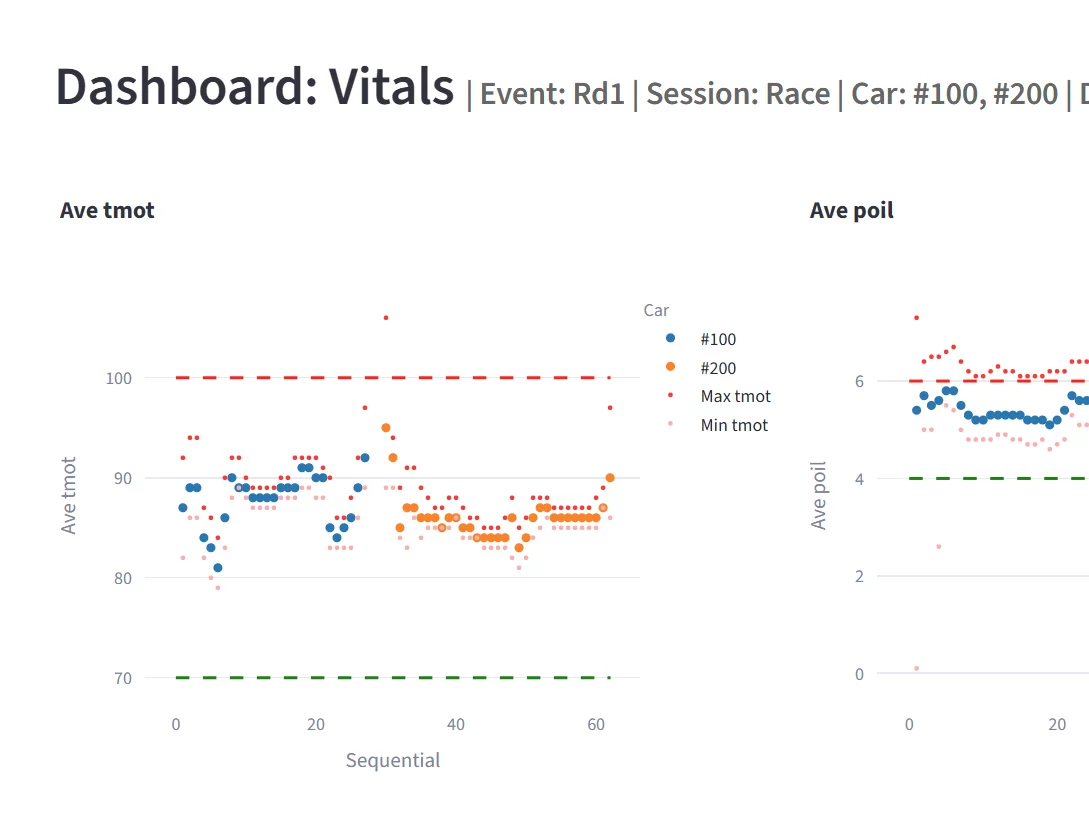
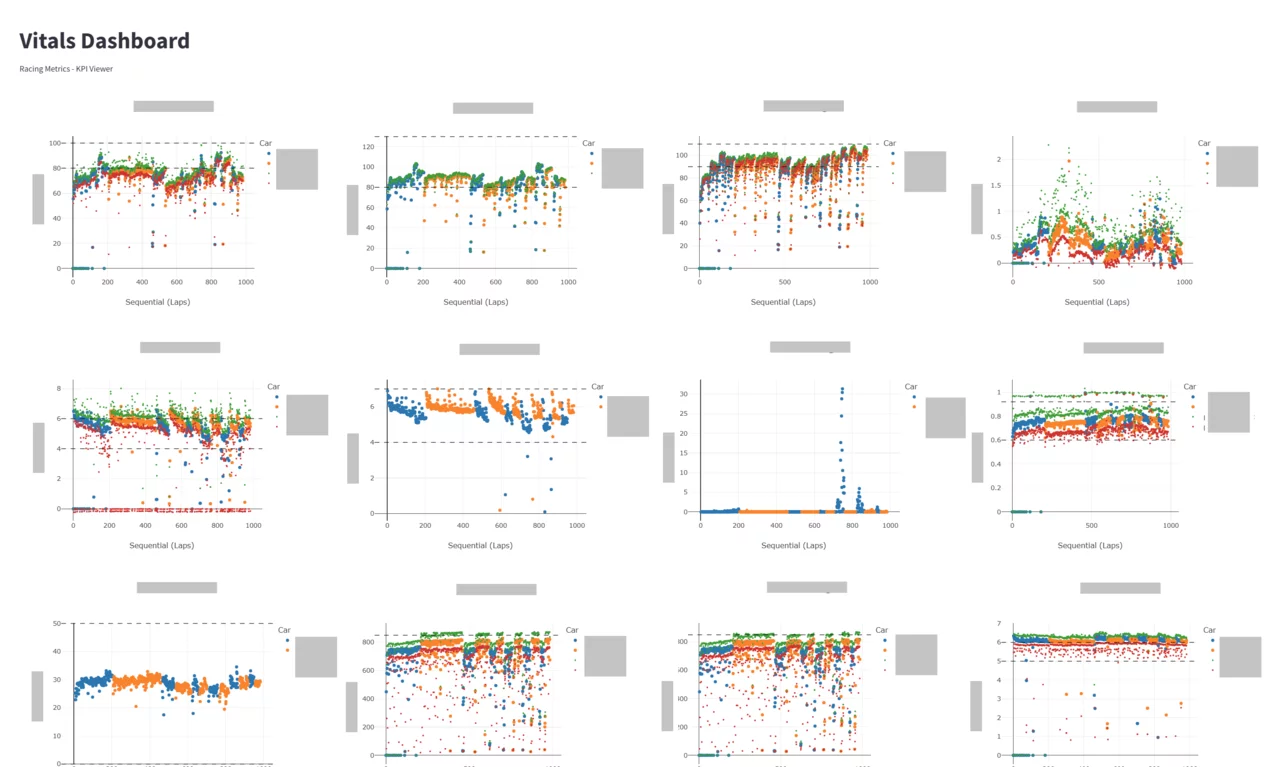
Interactive Dashboards with up to 25 Charts per page on up to 50 pages.
Easy configuration of dashboard setting with smart suggestions.
Real-Time Filtering for dynamic data exploration with advanced filtering options.
Dyamic HTML reporting function
Security & Authentication
Two-factor Authentication (2FA) available
Encrypted storage (AES-256) of sensitive information
Secure Google™ sign in available
Enterprise-grade security featuring like threat monitoring and brute force protection
Secure Payments with Stripe™ Integration
Privacy-First
No Data Storage of your uploaded files
Zero Third-Party Sharing of your data or information
Compliant with GDPR & DSGVO
No Credit Card details stored on our servers
Billing Privacy with 2FA protecion for subscription management
How the KPI Tool works
1. Define your KPIs and Channels
Use your data logging software to generate Data Tables. This
way it works with any system than allows to export to
Excel.
2. Export your Data
Export your KPIs to Excel for easy collection and management.
3. Create Pages, add your Channels
You have the flexibility to create your own views and safe the configuration for later use.
4. Manage your Channels
The editor allows you to modify the channels and lets you add
secondary channels and upper and lower limits.
5. Visualise and Share
Analyse your data in a repeatable pattern. Creat dynamic HTML
report from th page views to share.
"As the founder of Racing Metrics and an active race engineer, I rely on this tool every day - both at the track and between events - to analyze race data and drive performance improvements."
"I am proud to finally make this Racing Metrics - KPI Tool available to fellow engineers who are dedicated to maximizing results week in and week out. This is the tool I trust to deliver insights when it matters most."
Alexander Thönnes - Founder of Racing Metrics
Frequently Asked Questions
Q: Is my data private?
A: Yes, your data is processed securely and never leaves your browser session. No uploaded data is stored or saved on our servers. That is an important privacy feature to us.
Q: Can someone see the content or filen ames uploaded data files?
A: No, neither we at Racing Metrics nor any of our partners nor any other users have access to your uploaded data files or see the file names. Your uploaded data files get never stored on any server.
Q: Do you log my data?
A: For security, auditing, and improvment, we log user interactions with this tool. But important to us and for you: We NEVER log the content of your files! We NEVER log the filenames! Your uploaded data is not stored on any server.
Q: What do you do with my uploaded data?
A: Nothing. It is not saved or stored. It is temporarily in the RAM to display the data for your use. As it is not stored or saved on any server, this uploaded data is lost as soon as the session ends, or you close browser, or you press refresh, or you upload another data file.
Q: Can you see my password?
A: No. Your password is stored encrypted with the latest encryption technology.
Q: Can I customize the Dashboard pages?
A: Yes, you can use the config page to adjust settings on which graph is shown on which page.
Q: How do I change the language?
A: Use the language selector in the sidebar.
Q: What is the required data format in the Excel file?
A: These are the requiered columns in the Excel Sheet:
'Event', 'Session', 'Car', 'Driver', and then in the next columns all your data channels.
The text in the first row gets used as the Header for the channels.